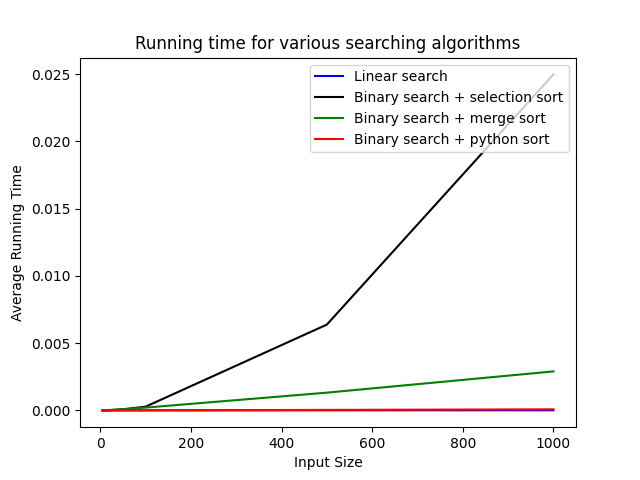
In the first 3 weeks, we learned about using matplotlib to sketch different graphs, the Big-O and probabilities.
MatPlotLib
As I already know how to sketch graphs using matplotlib, my focus was on how to save the generated plot, how to clear the previous plot and what is a loglogplot.
Generate Data
As we need to generate different plots, I created a function that will return different name of the functions and the y-values by providing x-values:
1 | def getFunc(i, x): |
Different values of ‘i’ stands for different maths functions
Save/Clear/LogLogPlot
Since I have the name of the function and the values, I can easily plot them and save multiple graphs at ones:
1 | def plot(loglog=False): |
- Without calling
plt.clf(), the previous graph will stay on the sketch and this is not what I want for this scenario, therefore this function is called eachtime before sketching a graph - If
loglogis enabled in this function, it will generate a loglog graph otherwise just a normal graph. - To save a graph, it is easy just with one line of code:
plt.savefig(path), and the path is depend on whetherloglogis enabled or not and the ‘i’ value.
Big-O
The Big-O is wisely used in estimating the Time and Space Complexity for algorithms, it usually stands for the worst case proceessing time or the worst memory usage.
In these weeks we mainly studied on different sorting methods and different searching methods:
- Destructive Selection Sort
- Merge Sort
- Linear Search
- Binary Search
At the same time we compared the complexity of each:

Probability
We learned about sample places, different events and expected values. And I will implement something relates to this topic in next week’s work.
Why we learning these
I think the reason we learning these topics is because if we wanna build an AI in the future we need to make high-efficiency algorithms, at the same time we need to illustrate graphs, last but not least probability takes a great role in AI area.